Add Sentry to a Next.js SaaS in 10 Minutes (2026 Guide)
A step-by-step Sentry Next.js setup for indie SaaS founders — the wizard command, the four files it creates, the env vars, and the gotchas to avoid.
· Justin Boggs

Photo by Luke Chesser on Unsplash
Sentry Next.js setup in 2026 is a single command: npx @sentry/wizard@latest -i nextjs. The wizard installs the @sentry/nextjs SDK, generates the four configuration files Next.js 15 needs for App Router instrumentation, wraps your next.config.ts with withSentryConfig, creates a verification page at /sentry-example-page, and writes your auth token to .env.sentry-build-plugin. The whole thing takes about 10 minutes if you already have a Sentry account; this post is the founder-friendly walkthrough of what's actually happening, the env vars that matter, and the three gotchas that will burn you if you skip them.
TL;DR
- One command:
npx @sentry/wizard@latest -i nextjsfrom your project root.- The wizard creates
instrumentation-client.ts,sentry.server.config.ts,sentry.edge.config.ts,instrumentation.ts, andapp/global-error.tsx— five files, one purpose each.- The free tier covers 5,000 errors per month with one user seat — enough for most pre-revenue indie SaaS, per Sentry's pricing page.
- Set
SENTRY_AUTH_TOKENin your CI/CD provider so source maps upload on production builds.- Turbopack dev mode is not yet fully supported by the SDK — run
next devwithout Turbopack while you're verifying.
Why bother with error monitoring for a small SaaS
The first time you ship a SaaS, the question "did anyone hit a bug today?" is one you ask a hundred times a day, mostly silently. Without error monitoring, you find out the answer when a user emails you — or when they don't, and they just churn. With error monitoring, you find out three seconds after the bug fires, with the full stack trace, the user's session leading up to it, and (with Session Replay enabled) a video of what they saw on screen.
Sentry is the boring, correct answer for indie SaaS error monitoring in 2026. It's not the only viable choice — Bugsnag, Rollbar, and LogRocket all serve the same category — but Sentry has the deepest Next.js integration, the most generous free tier for what it provides, and a wizard that does the wiring for you. The Next.js + Supabase + Stripe + Resend stack ships with Sentry as the default error monitor for exactly this reason.
A pre-revenue indie SaaS rarely needs more than the free tier. The Developer plan, per Sentry's official pricing, gives you 5,000 errors per month, one user seat, and 30-day retention. When you cross 5,000 events, Sentry stops accepting new ones until your billing cycle resets — you don't get a surprise bill. For a founder shipping to the first 100 paying customers, that ceiling is rarely binding; for a founder running an established product with marketing traffic, it lasts about as long as you'd expect.
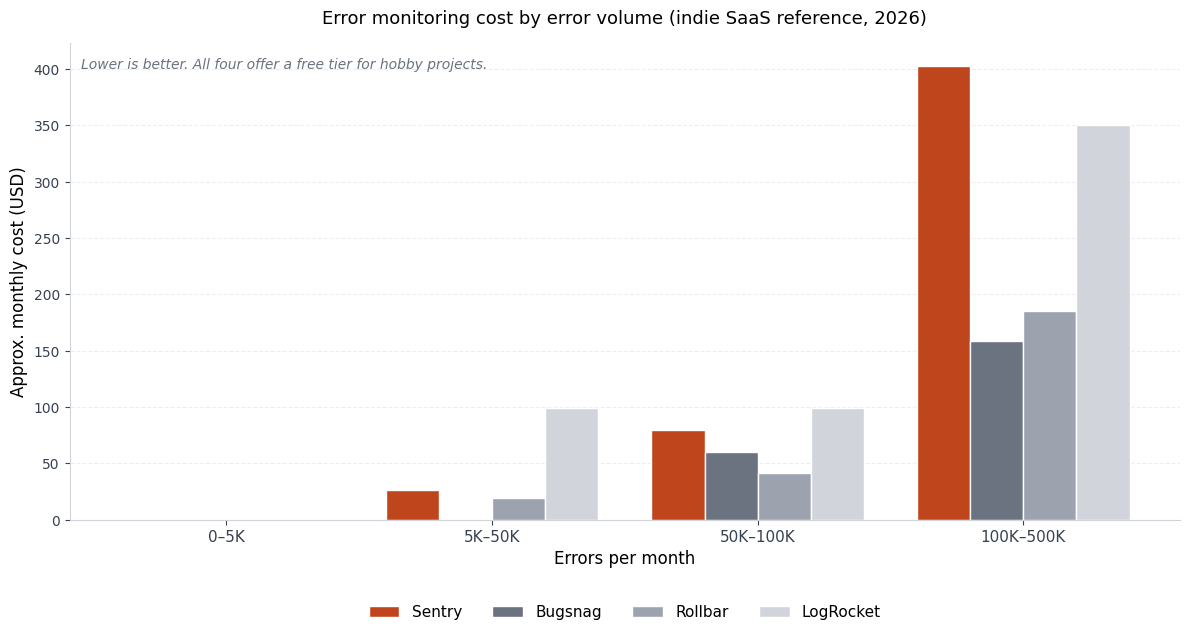
The chart above is a reference point — exact numbers move with each provider's repricing, but the shape is stable: at indie SaaS volume, you're paying somewhere between $0 and $80 a month for error monitoring, and the time it saves you in the first crash you would have missed is worth a year of the bill. The right comparison is not "Sentry vs. nothing" — it's "10 minutes of setup vs. a churned customer who didn't tell you why."
The one-command setup that does everything
The fastest way in is the Sentry Next.js wizard, an interactive CLI that handles the install, the configuration, the env vars, and the verification page in a single run. From the root of your Next.js project:
npx @sentry/wizard@latest -i nextjs
The wizard will:
- Ask you to log into Sentry (browser-based — no API key copy-paste).
- Ask you to pick or create a Sentry project. Pick "Next.js" as the platform.
- Ask which features you want: Error Monitoring (always on), Tracing (recommended), Session Replay (great for support, costs more replays), Logs (the newer structured-log feature).
- Install
@sentry/nextjsas a dependency. - Generate the five Sentry files you need (more on each below).
- Wrap your
next.config.tswithwithSentryConfigto enable source map uploads. - Write your DSN into the config files and your auth token into
.env.sentry-build-plugin. - Add
.env.sentry-build-pluginto your.gitignoreso the token doesn't get committed.
When the wizard finishes, run npm run dev, visit http://localhost:3000/sentry-example-page, click the "Throw Sample Error" button, and check your Sentry dashboard. The error should appear within 10–15 seconds with a full stack trace pointing back at your source code. If it does, your install is working. If it doesn't, the wizard left you a troubleshooting URL on stdout — follow it before tweaking anything else.
If you're a non-developer using Claude Code or Cursor, this is the kind of task where you let the wizard do its thing without an AI in the loop, because the wizard is more reliable than asking an AI to wire it for you. AI tools earn their keep on the customizations you make after the wizard, not the install itself. The Claude Code for non-developers guide covers when to reach for the AI and when to let the official tool drive.
The four files the wizard creates (and what each one does)
Once the wizard finishes, you'll see four (or five, with global-error.tsx) new files in your repo. Reading them once will save you future debugging time, because the next time Sentry doesn't capture an error you expected, the answer is almost always in one of these files.
instrumentation-client.ts (browser)
This file initializes Sentry in the browser. It runs before your React app boots, captures unhandled errors in user sessions, and (if you enabled Replay) starts recording. The DSN is hardcoded here — that's fine and intentional; the DSN is a public identifier, not a secret.
A typical wizard-generated file looks like the snippet in the official setup docs — Sentry.init({ dsn, tracesSampleRate, replaysSessionSampleRate, integrations: [Sentry.replayIntegration()] }). The numbers you'll want to tune are tracesSampleRate and the two replays*SampleRate knobs (see the gotchas section).
sentry.server.config.ts (Node.js server)
This initializes Sentry on the server side — for server actions, API routes, and any code running in the Node.js runtime. Same Sentry.init shape, but no session-replay options (replay is browser-only). The server config captures exceptions thrown inside "use server" functions, errors from API handlers, and uncaught promise rejections.
sentry.edge.config.ts (Edge runtime)
If you use Next.js Edge Runtime for any route (middleware always runs in Edge, and certain /api/* handlers can opt into it), this is what initializes Sentry there. The Edge runtime is a constrained subset of Node — different APIs, different limits — so it needs its own initialization rather than reusing the server config.
instrumentation.ts (registration)
This is the file Next.js looks for to wire up runtime instrumentation. The wizard generates a small register() function that conditionally loads sentry.server.config or sentry.edge.config based on the NEXT_RUNTIME environment variable. It also exports onRequestError = Sentry.captureRequestError, which is the hook Next.js 15 calls when a request handler throws. The onRequestError hook requires @sentry/nextjs 8.28.0 or higher and Next.js 15 — both of which the wizard installs current versions of by default.
The reason this matters: if you're upgrading from an older Sentry install that predates instrumentation.ts, the migration guide is the document to follow. A manual port of the old _app.tsx pattern to the App Router instrumentation pattern is the kind of thing that looks fine, runs fine, and then quietly stops capturing 70% of your errors.
app/global-error.tsx (React error boundary)
This is a special Next.js App Router file that catches rendering errors anywhere in your app and re-throws them to Sentry. The wizard generates a minimal version with Sentry.captureException(error) inside a useEffect. Customize the UI to match your brand, but leave the captureException call alone. If you delete this file, React rendering errors silently disappear into the void.
Env vars and CI/CD: the part everyone forgets
The wizard wrote your Sentry DSN into the config files. That's not a secret — it's safe to commit. What is a secret is the SENTRY_AUTH_TOKEN, which lives in .env.sentry-build-plugin (added to .gitignore automatically). That token is what authorizes source map uploads from your build server to Sentry's source maps store.
Source maps are how Sentry turns a minified stack trace like function a(b,c) at line 1 of a 50,000-character bundle into a readable trace pointing at app/dashboard/page.tsx:42. Without source maps, your Sentry dashboard is full of unreadable error messages and you'll waste an hour per bug guessing what file the trace came from. With source maps, debugging feels like the dev tools you already know.
In CI/CD — Vercel, GitHub Actions, GitLab CI, whichever — you need to set SENTRY_AUTH_TOKEN as an environment variable in your build environment. On Vercel:
- Go to Settings → Environment Variables for your project.
- Add
SENTRY_AUTH_TOKENwith the value from.env.sentry-build-plugin. - Apply it to Production, Preview, and Development environments (the dev one is mostly for local builds; you can skip it if you only build locally with
next build).
Triple-check that the token only has the minimum scope it needs. The wizard provisions a project-scoped token by default, which can upload source maps to that one project and nothing else. That's correct. Do not paste an org-wide admin token into your CI — if it leaks, you've just handed someone admin on your whole Sentry organization.
Other env-related housekeeping:
| File | Committed? | Contains |
| --- | --- | --- |
| instrumentation-client.ts | Yes | DSN (public identifier) |
| sentry.server.config.ts | Yes | DSN, server tuning options |
| sentry.edge.config.ts | Yes | DSN, edge tuning options |
| .env.sentry-build-plugin | No | SENTRY_AUTH_TOKEN (secret) |
| .env.local | No | Any other secrets (Stripe, Supabase, etc.) |
If your .env.local file isn't in .gitignore, fix that before you do anything else. The Next.js + Supabase + Stripe + Resend stack post covers the broader secrets hygiene story for an indie SaaS; the Sentry-specific piece is just one row in that bigger table.
The four gotchas that will burn you (and how to defuse them)
These are the ones I've personally tripped over or watched other founders trip over. None of them are documented in big red letters; all of them are recoverable if you know what to look for.
Gotcha 1: Turbopack in dev mode. Next.js 15 made Turbopack stable for next dev, but as of mid-2026, the Sentry SDK does not yet fully support Turbopack in dev mode. The symptom: errors fire locally but never appear in your Sentry dashboard. The fix while you're verifying setup is to run next dev --no-turbo (or just next dev without the --turbo flag, depending on your version), confirm errors arrive in Sentry, then go back to Turbopack for daily dev work knowing that errors won't capture locally — they will capture in production builds, which is what matters. Check the Sentry release notes regularly; this is moving.
Gotcha 2: tracesSampleRate set to 1.0 in production. The wizard often generates tracesSampleRate: 1.0 for development and a lower value (often 0.1) for production. If you copy/paste the dev config into prod or forget to differentiate, you'll send 100% of your performance traces to Sentry, blow through the free tier in a day, and either get throttled or get a surprise bill on a paid plan. For a small SaaS, tracesSampleRate: 0.1 in production (sample 10% of transactions) is a sane default; tune up if you have low-volume but high-value endpoints you want full coverage on.
Gotcha 3: sendDefaultPii: true without thinking about it. The wizard sets this to true by default, which tells Sentry to capture user IPs and request headers. Useful for debugging. Also a regulatory consideration if you're under GDPR, CCPA, or HIPAA — IPs are PII, and storing them in a third-party processor is a thing your privacy policy needs to acknowledge. If you're not sure, set sendDefaultPii: false and selectively add user context via Sentry.setUser({ id, email }) after auth, which gives you the debugging value without leaking IPs to Sentry indiscriminately.
Gotcha 4: ad-blockers eating your client errors. Browser ad-blockers happily block requests to sentry.io, which means a chunk of your real users will never report errors. The fix is to use the tunnelRoute option in next.config.ts (the wizard sets it to /sentry-tunnel by default). That routes Sentry's events through your own server, which ad-blockers won't block because the request goes to your domain. Leave it on. If you turned it off thinking it was overhead, turn it back on.
The fifth honorable-mention gotcha, less common but worth flagging: don't import Sentry inside a Client Component file expecting Sentry.captureException to work on the server. The two runtimes have separate Sentry instances. Use the server config from server code and the client config from client code; for explicit captures from a server action, import from @sentry/nextjs inside that file and call Sentry.captureException there.
What to do after the install
Once errors are flowing into Sentry, the work shifts from setup to operations. A few habits that pay off:
Wire Sentry into your release process. The withSentryConfig setup uploads source maps on each build, but you can also tag releases with the Git commit SHA so you know which deploy introduced a regression. The Sentry release management docs cover the patterns; the short version is "set the SENTRY_RELEASE env var to your commit SHA at build time."
Set up alerts. Sentry's defaults are reasonable but noisy — you'll get an email for every new issue. Tighten that to "alert me on a regression in a top-100 issue" or "alert me when error volume spikes 3x in 10 minutes." The exact thresholds depend on your traffic; the principle is that alert fatigue is real, and a noisy Sentry inbox is one you stop reading.
Connect Sentry to your source control and chat. Sentry's GitHub integration adds inline annotations on commits and lets you create GitHub issues straight from a Sentry event. The Slack integration drops new errors into a channel — fine for a one-founder SaaS where the channel is just you, very useful for a small team.
If you want the full operational stack for a small SaaS — analytics, session replay, status pages, incident response — Sentry is one node in a graph. The Coding Capybaras integration marketplace is where I keep the copy-paste AI prompts for each of those, so you can wire one up in a single session instead of debugging configuration drift for an afternoon.
Frequently asked questions
How long does Sentry setup actually take?
For a fresh Next.js 15 project with no prior monitoring, the wizard takes about 10 minutes end-to-end — 2 minutes to install, 5 minutes of approving config choices and signing into Sentry, 3 minutes to verify the test error fires. Add another 10 minutes if you need to set up SENTRY_AUTH_TOKEN in your CI provider, which you should.
Will Sentry slow down my Next.js app?
The runtime overhead is minimal — Sentry's SDK is event-batched and fires errors asynchronously. The build-time overhead is more noticeable because withSentryConfig adds source map upload to every production build; expect 30–90 seconds of extra build time depending on bundle size. For Vercel deploys, that's well within the free tier's build minute limits.
Should I enable Session Replay?
For a pre-revenue SaaS where you're trying to understand why users churn, yes — Session Replay is the single most valuable Sentry feature, because watching a user's actual session leading up to an error is worth ten support emails. The cost is that replays count toward a separate quota and the free tier's replay allowance is smaller than the error allowance. Sample conservatively (10% of sessions is a fine default) and turn it up if you need more visibility.
What's the difference between Sentry's Tracing and PostHog's session recording?
They overlap but solve different problems. Sentry Tracing measures performance — how long a page took to load, which API call was slow, where the bottleneck is. PostHog's session recording (and product analytics generally) measures behavior — what users clicked, where they dropped off, which features they used. Most indie SaaS founders end up running both: Sentry for "why is this broken" and PostHog for "what are people doing". They don't compete; they coexist.
Can I use Sentry with a Pages Router Next.js project?
Yes — the wizard handles both the App Router (the default in Next.js 15) and the Pages Router. The generated files differ slightly, but the setup flow is the same. Sentry has a dedicated Pages Router setup guide if you're on the legacy router.
Is the free tier really enough for a real SaaS?
For most indie SaaS in the first year, yes — 5,000 errors per month is more than most products generate if the code is reasonably well-tested. The free tier caps you at one user seat, which becomes the binding constraint the moment you bring on a cofounder or a contractor. The next plan up is Team at $26/month for additional seats and higher error quotas — almost always worth it the day you cross the team-of-one threshold.
The honest take
Error monitoring is one of those founder tasks that feels low-priority until the first time a paying customer churns and you don't know why. Sentry on a Next.js SaaS in 2026 is a 10-minute install with a wizard that does the right thing by default, a free tier that covers most pre-revenue founders, and a documented path to grow into. There is no good argument for skipping it on a paid product.
If you're starting a new Next.js SaaS and want the rest of the operational stack (auth, billing, email, analytics) wired up with the same opinionated defaults as the Sentry setup above, Coding Capybaras is the free boilerplate I built around exactly this workflow. The integration marketplace has the copy-paste prompts for Claude Code or Cursor that handle the Sentry install plus the rest of the indie SaaS plumbing in a single session.