Churn Analysis for Non-Tech Founders: Metrics That Matter
A plain-English guide to SaaS churn metrics: how to calculate customer and revenue churn, the 2026 benchmarks, and which numbers are worth acting on.
· Justin Boggs

Photo by Amritanshu Sikdar on Unsplash
Churn is the rate at which you lose customers or revenue, and for a non-technical founder the only two numbers worth starting with are customer churn (what fraction of customers left) and revenue churn (what fraction of recurring revenue left). Customer churn is the number who churned in a period divided by the number you started with. Revenue churn weights that by how much each customer paid. They can tell very different stories about the same month, and the gap between them is usually where the real lesson is. This guide explains both in plain English, gives you the current benchmarks, and tells you which churn numbers are worth acting on versus which are just anxiety.
TL;DR
- Customer churn = customers lost ÷ customers at start of period. Revenue churn weights that by dollars.
- Track both — losing one big account can be 3% customer churn but 50% revenue churn.
- Early-stage SaaS (under $300k ARR) churns at a median of about 6.5% per month; it falls as you grow, per ChartMogul.
- A chunk of churn is involuntary — failed credit cards — and a simple dunning email recovers much of it.
- The metric to optimize long-term is net revenue retention; above 100% means you grow even with zero new signups.
What churn actually measures
Churn is the leaky-bucket problem. You pour new customers in the top; some drain out the bottom. Churn is the size of the hole. You can pour faster (acquisition) or patch the hole (retention), but if the hole is big enough, no amount of pouring keeps the bucket full. That is the entire reason churn matters: past a certain rate, growth becomes impossible no matter how good your marketing is.
There are two ways to measure the hole, and you need both.
Customer churn — also called logo churn — counts people. It answers "what fraction of my customers left this period?" Revenue churn counts dollars. It answers "what fraction of my recurring revenue left this period?" ChartMogul, whose benchmarks come from aggregated data across more than 2,500 SaaS businesses, frames these as the two foundational churn metrics, and the reason you watch both is that they diverge.
Here is the classic example. Say you have three customers paying $20, $30, and $50 a month — $100 total. The $50 customer cancels. Your customer churn is 33% (one of three left). Your revenue churn is 50% (half your money left). If you only watched customer churn, you would log a routine bad month. In reality you lost half your business. The opposite happens too: lose your cheapest customer and customer churn looks scary while revenue barely moves.
For a non-technical founder the takeaway is simple. Customer churn tells you whether people like the product. Revenue churn tells you whether the business is healthy. When they disagree, believe revenue churn.
How to calculate customer churn
The formula is more careful than it first looks. The clean version from ChartMogul is:
Customer churn rate = customers who churned in the period ÷ customers at the start of the period.
Three details keep your number honest:
- Only count paying customers. Free-trial and free-plan users do not belong in the denominator. If you mix them in, your churn rate becomes meaningless because trial drop-off swamps real cancellations.
- Handle the in-and-out cases. Someone who joined and cancelled within the same period, or who cancelled and then reactivated, will skew the math. ChartMogul's worked example: start with 100 customers, 12 churn during the month, but of those one had reactivated and one had joined that same month — so the true churn count is 10, and the rate is
(12 − 2) ÷ 100 = 10%. - Pick a consistent period. Monthly is standard for early-stage SaaS because it gives you a fast feedback loop. Just compare like with like — never a monthly rate against an annual one.
A quick gut-check on why small percentages matter so much: a 5% monthly churn rate compounds to losing about 46% of your customers over a year (0.95 to the 12th power is roughly 0.54). Five percent sounds survivable until you run the compounding. That math is why founders who ignore churn early get blindsided a year later.
If you are setting up the tracking for the first time, churn is one of the handful of numbers worth putting on your dashboard from day one. The wider set of early metrics — and which ones are noise — is covered in the first-month SaaS dashboard, and the analytics plumbing to capture cancellation events is the same PostHog setup most indie SaaS apps already run.
What's a good churn rate? The 2026 benchmarks
There is no single "average" churn rate, but there are solid benchmarks by company size. The pattern is consistent: churn is highest when you are smallest, and it falls as you find product-market fit and tighten your ideal customer profile.
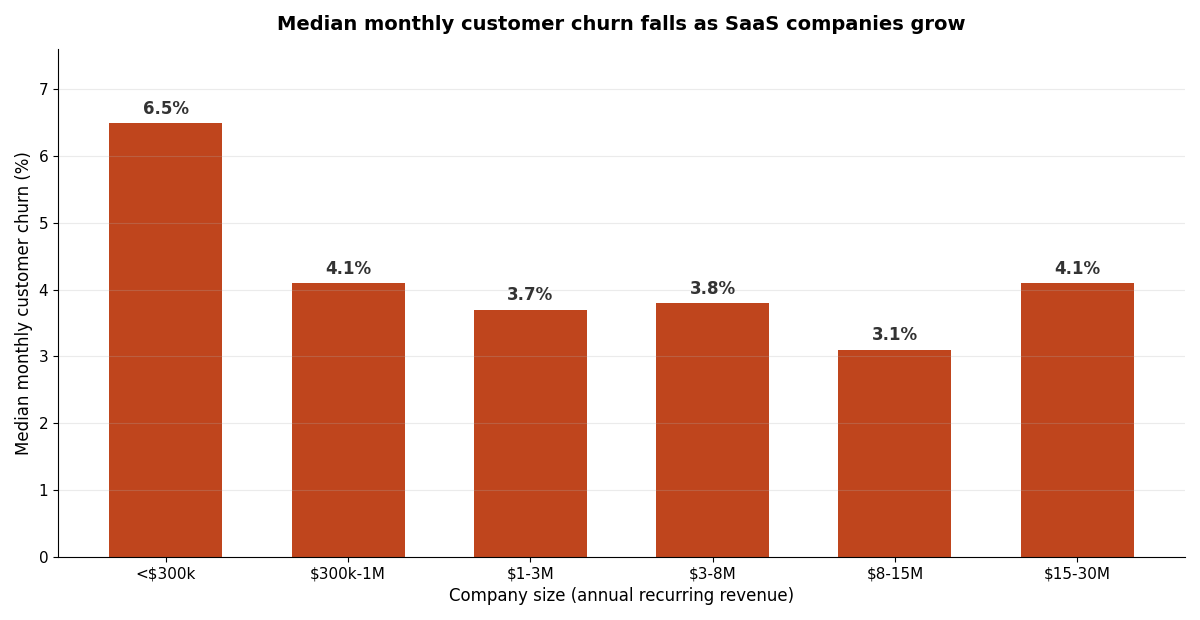
According to ChartMogul's benchmark data, a median early-stage company under $300k ARR has a monthly customer churn rate of about 6.5%. By $1–3M ARR the median drops to 3.7%, and companies over $8M ARR sit around 3.1%. Here is the fuller picture by company size:
| Company size (ARR) | Top quartile | Median | Bottom quartile | | --- | --- | --- | --- | | Under $300k | 3.2% | 6.5% | 11.6% | | $300k–$1M | 2.5% | 4.1% | 7.3% | | $1–3M | 2.2% | 3.7% | 6.9% | | $3–8M | 2.3% | 3.8% | 6.5% | | $8–15M | 2.0% | 3.1% | 5.6% |
(Monthly customer churn, from ChartMogul's aggregated SaaS data.)
Two honest caveats before you compare yourself to these. First, if you are pre-$300k ARR — which most readers of this blog are — a churn rate that looks "bad" against a mature company is normal for your stage. Do not panic at 6%. Second, churn also varies by how much customers pay you. ChartMogul's data shows that low-price products (under $25/month ARPA) churn at a median 6.1% while products over $500/month churn at 2.2% — cheaper customers leave more easily, which is one more argument for not pricing too low. The full reasoning on where to set price is in SaaS pricing for non-tech founders.
The types of churn (and why the distinction pays)
"Churn" hides several different problems, and they each have a different fix. Lumping them together is the most common analysis mistake non-technical founders make. Here is the breakdown that actually changes what you do.
| Type of churn | What it means | What fixes it | | --- | --- | --- | | Voluntary (proactive) | Customer chose to cancel | Product value, onboarding, pricing fit | | Involuntary (delinquent) | Payment failed, card expired | Dunning emails, card-update prompts | | Happy churn | Finished the job they hired you for | Often unavoidable; expect it in seasonal tools | | Negative churn | Expansion revenue exceeds losses | The goal — upsells outpacing cancellations |
The one that surprises people is involuntary churn. These are customers who did not decide to leave — their credit card expired or a payment bounced. ChartMogul notes cases where involuntary churn accounts for as much as a third of all churn, and much of it is recoverable with a simple dunning sequence: an automated email when a payment fails, a few polite retries, a prompt to update the card. This is the highest-ROI churn work a small founder can do, because the customer already wants to stay — you just have to ask them to fix their card.
If you are not running dunning emails yet, it is a short automation. The lifecycle-email patterns — including failed-payment recovery — are in lifecycle email for indie SaaS, and any of the transactional email providers can send them.
Voluntary churn is the hard one, because it means someone weighed your product and chose to leave. The usual root causes are poor onboarding (they never hit the "aha" moment), price not matching perceived value, or the wrong customer in the first place. The fixes are slower — better onboarding, clearer value, tighter targeting — but they are where durable retention comes from. Customer onboarding flows is the lever with the biggest early payoff, because first-month churn is almost always an onboarding problem.
The metric that matters most long-term: net revenue retention
Once you are past the first few months, the single number that best predicts whether your SaaS compounds is net revenue retention (NRR) — sometimes called net dollar retention. It measures how much recurring revenue you keep from existing customers over a period, after accounting for upgrades, downgrades, and cancellations.
The formula, in plain terms: take your starting MRR, add expansion (upgrades), subtract contraction (downgrades) and churn, then divide by the starting MRR. To understand it you have to know the five movements that make up MRR change: new business, expansion, reactivation, contraction, and churned revenue. NRR ignores new business and asks: of the customers I already had, am I growing or shrinking?
The magic threshold is 100%. Below it, your existing base is shrinking and you have to keep acquiring just to stand still. Above it, you have what ChartMogul calls negative churn — expansion revenue from existing customers outweighs everything you lose, so the business grows even if you never sign another new customer. The median B2B SaaS sits around 106% NRR, with top performers above 120% and best-in-class above 130%.
For a non-technical founder, NRR reframes the whole churn conversation. Instead of "how do I stop people leaving," it becomes "how do I make the customers who stay more valuable over time." That is usually a product and pricing question — adding tiers people grow into, add-ons that map to real value — and it is more durable than chasing every cancellation. It is also the number acquirers care about most; retention is increasingly the metric that drives SaaS valuation, not raw growth.
How to find out why customers actually leave
A churn rate tells you that people are leaving. It never tells you why. The rate is the smoke alarm; the diagnosis is separate work, and it is where most of the actual retention gains come from. Three tools do almost all of it, and none require an analyst.
Cohort analysis is the most useful and the most underused. Instead of one blended churn number, you group customers by the month they signed up and watch each group's retention over time. The question it answers is "at what point in a subscription's life is churn highest?" For most early SaaS the answer is brutal and clarifying: churn spikes in the first or second month. As ChartMogul puts it, high first-month churn means customers never reached the "aha" moment that shows your product's value — which makes it an onboarding problem, not a product-quality problem. If your cohorts flatten out after month three, you have a leaky front door, not a leaky product.
Exit surveys are the cheapest qualitative signal you can get. One required question on the cancellation screen — "what's the main reason you're leaving?" with four or five options plus a free-text box — turns anonymous churn into a ranked list of causes. You do not need a sophisticated tool; you need to actually read the answers each week. The patterns show up fast, and they are usually not what you assumed.
Usage data lets you see churn coming before it happens. Customers rarely cancel out of nowhere — they go quiet first. If you track a simple engagement signal (logins per week, a core action performed), you can spot accounts that have gone dark and reach out before they cancel rather than after. The PostHog setup in the analytics walkthrough captures exactly these events, and the same data feeds the dashboard you should be watching.
The point of all three is to convert a scary aggregate number into a specific, fixable cause. "We're at 6% churn" is anxiety. "Forty percent of cancellations happen in week one and the exit survey says onboarding was confusing" is a to-do list. Always push from the first toward the second.
Frequently asked questions
How do I calculate churn rate?
Divide the number of paying customers who churned during a period by the number of paying customers at the start of that period. Exclude free-trial and free-plan users, and adjust for anyone who joined and churned, or churned and reactivated, within the same period so they do not skew the count.
What is a good monthly churn rate for an early-stage SaaS?
There is no universal average, but ChartMogul's benchmark for a median company under $300k ARR is about 6.5% monthly customer churn. It falls toward 3–4% as you cross $1M ARR. If you are very early, do not panic at a number that would be alarming for a mature company — your stage churns higher by default.
What's the difference between customer churn and revenue churn?
Customer churn counts how many customers left; revenue churn counts how many dollars left. They diverge when customers pay different amounts — losing one large account can be a small customer-churn number but a large revenue-churn number. Watch both, and trust revenue churn when they disagree.
What is involuntary churn and how do I reduce it?
Involuntary (or delinquent) churn happens when a payment fails — usually an expired or declined card — rather than a deliberate cancellation. It can be a third of total churn. A dunning sequence (automated failed-payment emails with retries and a card-update prompt) recovers a large share of it, and it is the cheapest retention win available to a small founder.
Should I worry about churn before I have many customers?
Track it from day one, but interpret it loosely while your customer count is small — with 20 customers, one cancellation is a 5% swing, so the percentage is noisy. Watch the reasons customers leave more than the rate itself early on; the patterns in those reasons are what you act on.
Wrapping up
Churn analysis does not require a finance degree. Start with two numbers — customer churn and revenue churn — calculate them honestly each month, and separate the involuntary churn you can recover with a dunning email from the voluntary churn that points at a product or fit problem. As you grow, shift your attention to net revenue retention, because a base that expands faster than it leaks is what turns a SaaS into a compounding business.
If you are building the SaaS these metrics describe, Coding Capybaras is the free boilerplate I built for non-technical founders — billing, lifecycle email, and the event tracking you need to measure churn ship wired up, so you can watch the numbers instead of building the plumbing.