SaaS Monitoring Stack 2026: Free-Tier Setup | Coding Capybaras
A practical SaaS monitoring stack for 2026: what errors, uptime, logs, and traces each catch, and the free-tier combination that covers a solo founder.
· Justin Boggs
Photo by Luke Chesser on Unsplash
A solo founder's SaaS monitoring stack in 2026 needs four layers, and each one catches a different kind of failure: error tracking tells you when your code throws, uptime monitoring tells you when your whole site is down, logs tell you what happened leading up to a problem, and traces tell you which slow step made a request crawl. You do not need to pay for any of this to start. A working combination — Sentry for errors, Better Stack for uptime, and a log layer like Axiom — fits entirely inside free tiers that comfortably cover an early-stage app. This post explains what each layer actually catches, and the specific free-tier stack I'd wire up on day one.
TL;DR
- Monitoring has four practical layers: errors, uptime, logs, and traces. Each answers a different question.
- Start with errors and uptime — they catch the failures that lose customers, and both have generous free tiers.
- A solo founder can run the whole stack free: Sentry (5K errors/mo), Better Stack (10 uptime monitors), and Axiom or similar for logs (500 GB/mo).
- Add tracing later, when a specific slowness problem justifies it. Don't buy observability you can't yet read.
What each layer actually catches
The industry frames observability as three pillars — logs, metrics, and traces — and that's the right mental model, but for a founder shipping a SaaS it's clearer to think in terms of four practical questions, because "did it crash?" and "is it down?" are different alarms that ring at different times.
Error tracking answers: did my code throw an exception? When a user hits a bug — a null value, a failed API call, an unhandled edge case — error tracking captures the stack trace, the browser, the user, and the exact line. Without it, you find out about bugs when a customer emails you, if they bother. With it, you get an alert the moment it happens, often before anyone complains.
Uptime monitoring answers: can the outside world reach my site? This is a robot that pings your URL every few minutes from multiple locations. If your site returns an error or times out, you get paged. Error tracking can't catch this — if your whole app is down, there's no running code to report the error. Uptime monitoring is the layer that catches a bad deploy, an expired certificate, or a database that fell over.
Logs answer: what was happening right before the problem? Logs are the timestamped diary of your application — requests coming in, jobs running, decisions being made. When an error fires, the logs are what you read to reconstruct the sequence that led there. Structured logs (searchable, with metadata) beat plain text you have to grep.
Traces answer: why was this request slow? A trace follows one request through every step — the database query, the third-party API call, the render — and shows you where the time went. Traces are how you find the one 400ms query dragging down a page. They're the most advanced layer and the one you'll add last.
Here's how they fit together across the life of a single failing request:
flowchart LR
    A[User request] --> B{Site reachable?}
    B -- No --> U[Uptime monitor pages you]
    B -- Yes --> C[Request runs]
    C --> D[Logs record each step]
    C --> E{Exception thrown?}
    E -- Yes --> F[Error tracker captures stack trace]
    E -- No --> G{Too slow?}
    G -- Yes --> H[Trace shows the slow step]
    G -- No --> I[Request succeeds]
No single layer is enough on its own. Uptime tells you that you're down but not why; errors tell you what threw but not the sequence; logs give you the sequence but not the timing; traces give timing but won't page you at 2am. Together they cover the failure space.
Where a solo founder should start
If you only set up two things this week, set up error tracking and uptime monitoring. They catch the failures that actually cost you customers — a broken signup, a checkout that 500s, a site that's silently down — and both are trivial to wire in.
Start with errors. The overwhelming majority of your incidents will be exceptions your code throws, and an error tracker turns a vague "it's not working" support ticket into a stack trace pointing at a specific line. This is doubly valuable if you're building with AI coding tools, because when Claude Code helps you debug, pasting the real stack trace and breadcrumbs from your error tracker gets you a fix far faster than describing the symptom. The monitoring tool feeds the AI the evidence.
Then add uptime. It's a five-minute setup — point a monitor at your homepage and your API health endpoint — and it's the only thing that catches a total outage. I've written a full walkthrough on setting up a Better Stack status page, and the same monitor doubles as your public status page, which buys you credibility when something does break.
Logs come third. You already have logs — your hosting platform captures them — but they're ephemeral and hard to search. A dedicated log layer keeps them longer and makes them queryable, which matters the first time you're debugging something that happened yesterday. It's worth doing, but it's not the thing that pages you.
Traces come last, and often much later. Tracing is powerful, but it produces a firehose of data that's meaningless until you have a specific performance problem to investigate and enough traffic to see patterns. Setting up distributed tracing on a pre-launch app is buying a tool you can't yet read. Wait until "this page feels slow" becomes a real, recurring complaint.
That ordering — errors, uptime, logs, traces — isn't about which is most sophisticated. It's about which failure loses you a customer fastest. A crash in checkout loses a sale today. A slightly slow dashboard is a problem you can afford to solve next quarter.
The free-tier stack that covers you
Here's the part that surprises founders: you can run all four layers for zero dollars well past your first customers. The free tiers of the major tools are genuinely useful, not crippled trials designed to force an upgrade.
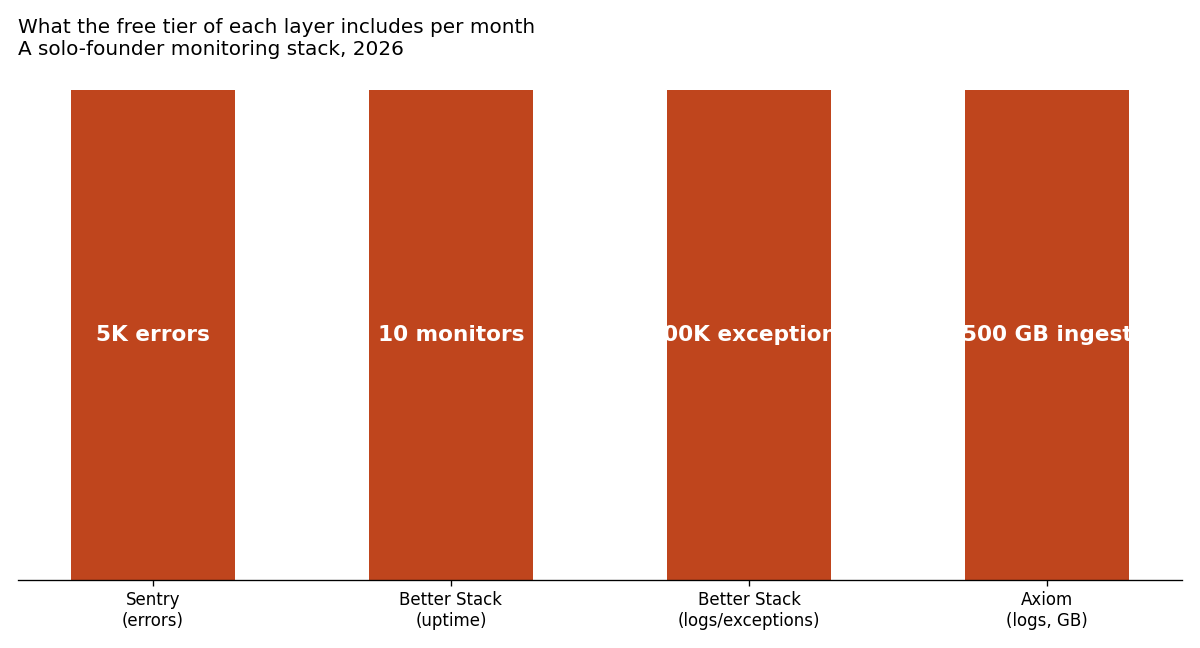
For errors, Sentry's Developer plan is free forever with 5,000 errors per month and one user. For an early SaaS, 5,000 errors is a lot — if you're hitting that ceiling pre-launch, you have a bug problem, not a plan problem. When you outgrow it, Sentry's Team plan runs about $26/month billed annually with 50,000 errors included.
For uptime, Better Stack's free plan includes 10 monitors with 3-minute checks, one status page, and email plus Slack alerts across three global locations. Ten monitors covers your homepage, your API, your auth flow, your payment webhook endpoint, and a few background jobs — more than enough surface area for a solo product. Paid plans start around $24/month if you need 30-second checks.
For logs, Axiom's free Personal tier includes 500 GB of ingestion per month. That's an enormous amount of log data for a small app, and it resets monthly. If you exceed it, ingestion pauses rather than billing you by surprise — a friendlier failure mode than a shock invoice.
| Layer | Tool | Free tier | First paid tier | | --- | --- | --- | --- | | Errors | Sentry | 5,000 errors/mo, 1 user | ~$26/mo (50K errors) | | Uptime | Better Stack | 10 monitors, 1 status page | ~$24/mo (30s checks) | | Logs | Axiom | 500 GB ingest/mo | ~$25/mo (1 TB) | | Traces | Sentry / add later | Included w/ Sentry spans | Scales with usage |
The honest tradeoff: free tiers cap retention and volume, and they don't come with a support contract. That's the right deal for an early founder. You're optimizing for "know when something breaks," not "enterprise compliance." When your monitoring bills start mattering, you'll have the revenue to think about it — and you'll understand your own volume well enough to choose deliberately. Until then, the free stack is not a compromise; it's the correct choice. Just budget for the day it isn't free, the same way you'd budget for any other hidden cost of SaaS infrastructure.
One consolidation note: several of these tools overlap. Sentry does errors and tracing. Better Stack does uptime and logs. You don't need four separate vendors — you can often cover the four layers with two tools, which means fewer dashboards to check and fewer bills to track.
Wiring it into a Next.js SaaS
For the common non-technical-founder stack — Next.js, Supabase, Stripe — the setup is mostly copy-paste, and AI coding tools handle the wiring well because these integrations are well-documented and stable.
Error tracking goes in first. Sentry's Next.js SDK auto-instruments both your server and browser code, so once it's installed, unhandled exceptions on either side get captured with full context. The Sentry integration guide walks through the exact steps, and the Sentry marketplace guide on Coding Capybaras has a copy-paste prompt that wires it into a Next.js + Supabase + Stripe app in one pass.
Uptime is even simpler because it lives outside your code — you're just registering URLs in a dashboard. Point one monitor at your homepage, one at a lightweight /api/health route that confirms your database connection, and one at anything mission-critical like your Stripe webhook handler. If you don't have a health endpoint, that's a five-minute addition your AI assistant can write.
Logs need a little thought about what to log. The temptation is to log everything, which buries the signal. Log the events that matter — a payment succeeded, a user signed up, a background job failed — with enough structure to search them later. And critically, never log secrets, tokens, or full personal data; logs get exported and shared, and a password in a log is a leak.
A word on alert fatigue, because it's the failure mode nobody warns you about. If every monitor pages you for every blip, you'll start ignoring the alerts, and then you'll miss the real one. Tune thresholds so you're only paged for things that need action now. A single 3am false alarm that turns out to be nothing will teach you this faster than any blog post. Route the noisy, informational stuff to a Slack channel you check on your own schedule; reserve actual pages for "a customer is affected right now."
The mistakes that make monitoring useless
Setting up the tools is the easy part. The failures I see — and made myself — are about how you run them.
The first is monitoring everything and reading nothing. It's satisfying to wire up ten dashboards, but a dashboard you never open is theater. Pick the two or three numbers that actually indicate health — error rate, uptime, and maybe checkout success — and make those the ones you glance at. Everything else is there for when you're investigating, not for daily staring.
The second is confusing system metrics with business metrics. Your monitoring stack tells you whether the software is working; it doesn't tell you whether the business is. CPU and error rate are system health. Signups, activation, and churn are business health, and they live in a product analytics tool, not your error tracker. I keep the two separate on purpose, and I built a first-month SaaS dashboard around the business side precisely because it answers different questions. Don't try to make Sentry tell you why users are leaving.
The third is treating a green dashboard as proof nothing's wrong. Monitoring only catches the failures you thought to watch for. A monitor pinging your homepage won't notice that your password-reset email silently stopped sending. That's why uptime checks on your critical flows — not just the homepage — matter, and why you still read customer feedback. Tools catch the failures you predicted; humans catch the ones you didn't.
Frequently asked questions
What's the difference between monitoring and observability?
Monitoring is watching known signals — is the site up, is the error rate normal — using dashboards and alerts you set in advance. Observability is the broader ability to ask new questions about your system's behavior after the fact, using logs, metrics, and traces together. For a solo founder, the practical distinction barely matters: set up the four layers, and you have both enough monitoring to be alerted and enough observability to investigate.
Do I really need all four layers to launch?
No. Launch with error tracking and uptime monitoring — those two catch the failures that lose customers. Add a log layer soon after, once you've had your first "what happened yesterday?" moment. Add tracing only when a specific, recurring slowness problem justifies the extra data. Layering them in over time is smarter than setting up everything at once and drowning in dashboards you never open.
Can I just use my hosting platform's built-in monitoring?
Partly. Platforms like Vercel give you basic logs and some analytics, which is a fine start. But they typically don't do rich error tracking with stack traces and user context, and they don't do independent uptime monitoring — if the platform itself has issues, its own monitoring may go with it. A separate uptime monitor that pings from outside your infrastructure is the one layer you shouldn't run in-house.
How much will monitoring cost once I outgrow the free tiers?
For most early SaaS products, the first paid step is roughly $25–30 per month per tool, and you usually cross into paid on one layer (often errors) well before the others. A realistic early-growth monitoring budget is $50–100/month total once you're past the free tiers, scaling with your traffic and error volume. You'll have paying customers by then, so it's a proportionate cost rather than an upfront one.
Is monitoring different when I build with AI coding tools?
The stack is the same, but monitoring becomes more valuable, because good telemetry feeds your AI assistant the evidence it needs to fix things. When a bug fires, a real stack trace and the surrounding logs let Claude Code or Cursor diagnose the actual problem instead of guessing from your description. Monitoring turns "it's broken" into "here's exactly what broke," which is the input AI debugging is best at.
The takeaway
A SaaS monitoring stack in 2026 comes down to four layers, each catching a distinct failure: errors when your code throws, uptime when your site is unreachable, logs for the sequence of events, and traces for where the time went. Set them up in that order of urgency, start entirely on free tiers, and add complexity only when a real problem asks for it. The mistake isn't spending too little on monitoring — it's setting up powerful tools you never learn to read.
If you're building a SaaS with AI coding tools, the Coding Capybaras marketplace has copy-paste prompts for wiring Sentry, uptime, and the rest into a Next.js + Supabase + Stripe app — the same monitoring setup this site runs on, free to start.